

20+
Years of experience
11
Branch offices
25000+
Facilities under service
22
Regions of operation

Our social media
India:
Uzbekistan:
MONTRANS ANALYTICS
A cloud-based solution that automates and digitizes the main fleet management processes and helps the head of an ATP to fully control the work of the company.
Implementation of an analytics, management and control system is an effective measure to optimize planning processes, reduce expenses on transport logistics, accounting and labor costs through detailed analysis of the use of vehicles, construction and other specialized equipment.
Implementation of an analytics, management and control system is an effective measure to optimize planning processes, reduce expenses on transport logistics, accounting and labor costs through detailed analysis of the use of vehicles, construction and other specialized equipment.
Fleet management system
MONTRANS ANALYTICS transportation analytics service is based on best practices.
All data on telemetry, fleet, drivers, trip tickets, logistics, fuel and MRO are integrated into one accounting system, which provides complete information on vehicles, eliminating possible errors and human error.
All data on telemetry, fleet, drivers, trip tickets, logistics, fuel and MRO are integrated into one accounting system, which provides complete information on vehicles, eliminating possible errors and human error.

Multilevel
Company/branch/location/type/subtype/vehicle/driver
Personalized dashboards
Consolidation of multiple data in one dashboard
Analysis, forecasting
A view from the top without waiting for reports from divisions
NEW SOLUTIONS IN FLEET MANAGEMENT
Flexibility
Unlimited number of filters at the same time
Analytics of any fleet management efficiency parameters
A vehicle management system allows you to control costs and helps you solve problems related to costs and fleet efficiency.
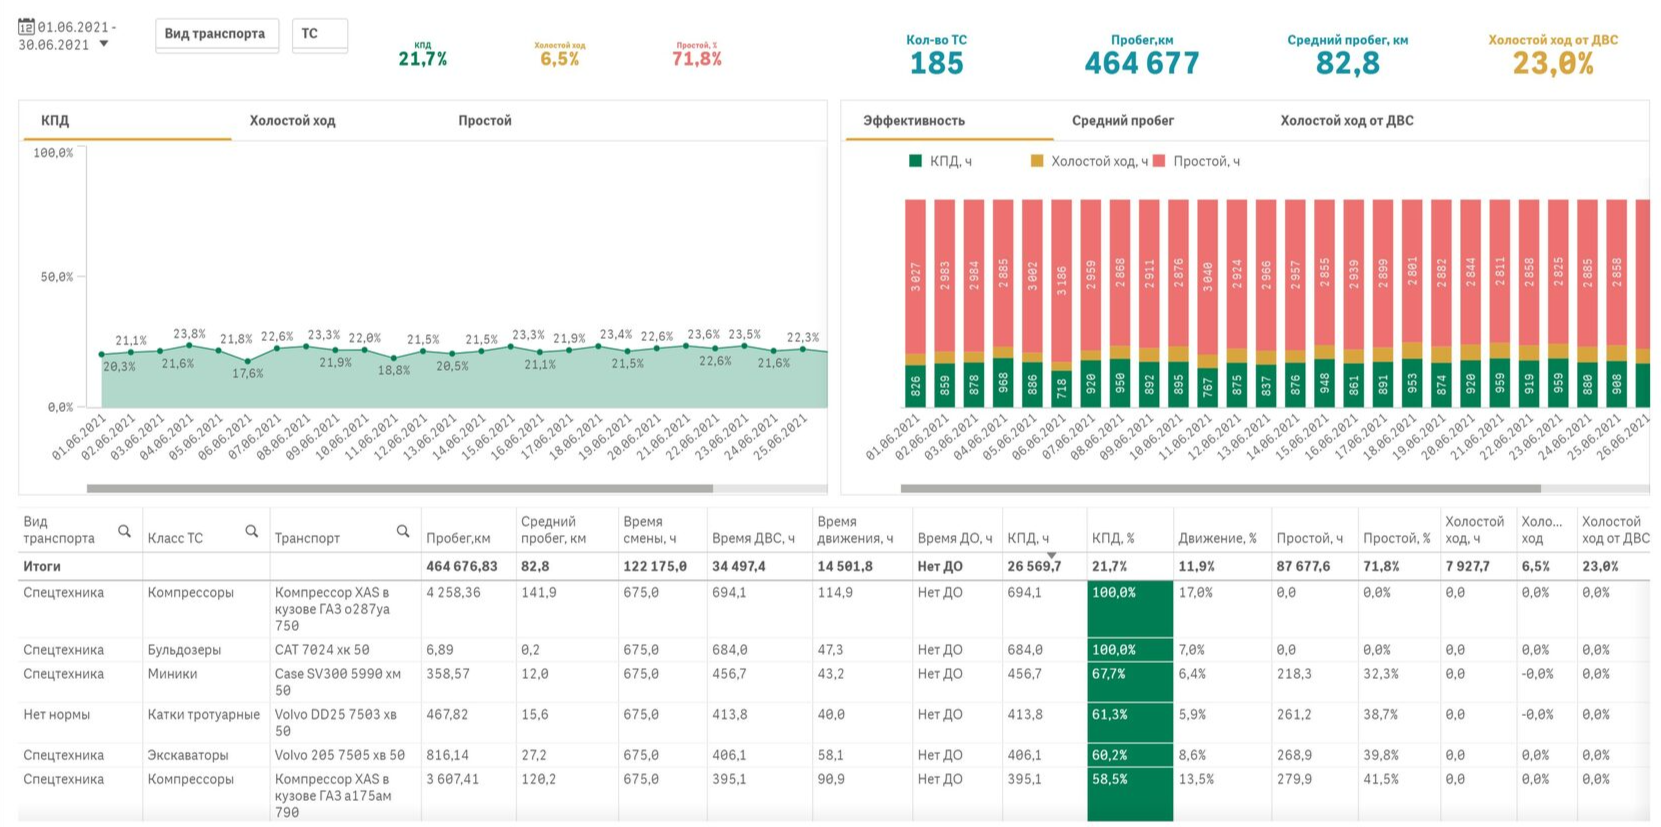
Dashboard Job Analytics
Efficiency of vehicle utilization at the enterprise in the form of bar and pie charts in % with division by
- efficiency - useful work, effective operating time of the vehicle;
- idle running - work of internal combustion engine at idle running;
- downtime - temporary suspension of vehicle operation due to economic, technical or organizational reasons.
- efficiency - useful work, effective operating time of the vehicle;
- idle running - work of internal combustion engine at idle running;
- downtime - temporary suspension of vehicle operation due to economic, technical or organizational reasons.

Desktop Fuel analytics
The section allows estimating the volume of fuel consumption for the enterprise as a whole, fuel consumption efficiency in comparison with basic norms. Distribution of fuel consumption by classes of vehicles, vehicles and sites (locations).


Program module - Refueling
The module stores the volumes of fuel dispensed and the volumes of fuel refueled. Fuel delivery according to fuel cards and refueling volumes according to fuel level sensors are measured, and underfilling of fuel in the fuel tank is displayed by vehicle.
Fuel underfills are displayed in bar diagrams and in widgets. The "Refueling Dynamics" diagram shows fuel underfills by calendar days for all or selected vehicles.
Fuel underfills are displayed in bar diagrams and in widgets. The "Refueling Dynamics" diagram shows fuel underfills by calendar days for all or selected vehicles.

Economic efficiency
Calculate the economic efficiency of your fleet in one window.
Fleet costs by expenses, depreciation, depletion, insurance, FTE, maintenance, fuel and lubricants
Fleet costs by expenses, depreciation, depletion, insurance, FTE, maintenance, fuel and lubricants
Thanks to analytical reports it is possible to estimate fuel losses at idling, both in percentage terms and in absolute terms in liters, select the necessary period, view details on the class of machinery of interest. The data on specific units of machinery and comparison of actual fuel consumption with the norms accepted at the enterprise are also pulled there in order to assess how efficiently fuel and lubricants are used and how much the consumption norms correspond to reality.
With the help of convenient reports you can see the details for the selected period and select the necessary class of vehicles for which we want to see the details. There is additional detailing by vehicles, locations, branches of the company.
Additionally, various metrics are displayed, which are agreed with the customer and can be customized for your needs. In the interface of the program there is a table with the initial data, based on which the dashboard on the efficiency of the fleet is built. In addition to the efficiency module, there is also fuel analytics.
Additionally, various metrics are displayed, which are agreed with the customer and can be customized for your needs. In the interface of the program there is a table with the initial data, based on which the dashboard on the efficiency of the fleet is built. In addition to the efficiency module, there is also fuel analytics.
Analytical reports on fleet utilization efficiency
Evgeny Kotov
MONTRANS service analyst
MONTRANS service analyst

The analytics system allows you to accumulate data from various sources and literally by pressing a few keys to receive a comprehensive analytical report, providing the full range of information in the dynamics of the processes occurring in the fleet, which will allow you to quickly make managerial decisions to improve the efficiency of the fleet of automotive, construction and other specialized equipment.
Video with sample reports and analytics program interface

Implementation cases
On average, after implementing transportation analytics, our clients see a 40% increase in efficiency
53%
Implementation results:
Increase in fleet efficiency
Decrease in the number of fuel thefts
Fuel savings indicators
FUEL BALANCE CONSTRUCTION
"CWS INTERNATIONAL"



500
MLN. Rub.
Implementation results:
Fuel savings per year
Reducing speeding events
Improving the correctness of telematics
ANALYZING PRODUCTION PERFORMANCE OF THE OPERATION NOVA
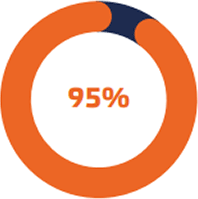
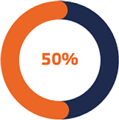


17%
Implementation results:
Increase in efficiency of machinery
Equipment availability factor (EAF)
Increase in machinery utilization rate (MUR)
IMPROVING ROAD SAFETY YAKOVLEVSKY GOK

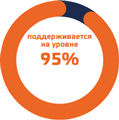


Manage your fleet efficiently!
Connect to a digital control system.


Integration of transport analytics with any ERP and production programs of the enterprise, to integrate all vehicle parameters from several systems into one management program
Single integrated analytics in one transportation management and control system
Fleet management program
Interoperates with ERP-systems (1C, SAP, ORACLE, etc.).

✔ Amortization
✔ Insurance
✔ MRO
✔ FOT


